StoPET Model
Overview
stoPET is part of the climate component of the CUWALID system. It fills the gap between the climate forecast and the hydrological forecast by generating potential evapotranspiration, PET, fields required to run the hydrological model.
stoPET generates stochastic realizations of PET at high spatial (0.1 degrees) and temporal resolution (1 hour). These PET values are generated based on historical values from the global hourly potential evapotranspiration dataset, hPET.
Model Description and Structure
stoPET is a stochastic potential evapotranspiration (PET) generator developed based on a global hourly PET dataset with high spatial resolution (hPET).
stoPET is designed to simulate realistic time series of PET that capture both diurnal and seasonal variability, and support the simulation of various climate change scenarios.
The stoPET model fits a sine function to the average diurnal cycle calculated from hPET for each month and grid cell. The sine curve captures the daily PET rhythm as shown below.
Sine Function Equation
The model uses this sine function:
Y = A * sin(B * t + C) + D
Where:
- A: Diurnal amplitude (mm/h)
- B: Frequency (1/h)
- C: Phase shift
- D: Vertical shift (mm/h)
- t: Time (h)
- Y: PET value (mm/h) from the sine function
Only daylight hours (sunrise to sunset) are used for the sine fit. PET values for nighttime are set to zero.
To simulate natural variability, the model includes a stochastic noise ratio. This noise is generated from a 40-year record of hPET data and applied to the sine function to create unique PET timeseries for each simulation.
Each day, random noise values are generated and multiplied with the sine-fitted PET values to produce a realistic, randomized hourly PET series.
Example Visualization
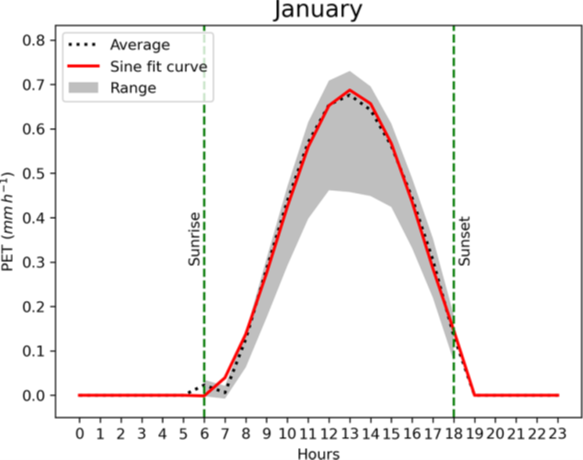
Figure 1 below shows:
- A sine curve (solid red) fitted over the average hourly PET values for January at Wajir, Kenya.
- The black dotted line is the 40-year average from hPET.
- The grey shaded area shows the range of PET values across all January days in the historical record.
- Green dashed vertical lines mark average sunrise and sunset times.
Diurnal Animation Example
This animation shows stoPET generating hourly PET values across the Horn of Africa Drylands. It visually captures daily patterns in solar radiation and heat build-up.